Gross Good and Services Tax (GST) revenue for March 2024 witnessed the second highest collection ever at Rs.1.78 lakh crore, with a 11.5% year-on-year growth. This surge was driven by a significant rise in GST collection from domestic transactions at 17.6%. GST revenue net of refunds for March 2024 is Rs.1.65 lakh crore which is growth of 18.4% over same period last year.
Strong Consistent Performance in FY 2023-24: FY 2023-24 marks a milestone with total gross GST collection of Rs. 20.18 lakh crore exceeding Rs.20 lakh crore, a 11.7% increase compared to the previous year. The average monthly collection for this fiscal year stands at Rs.1.68 lakh crore, surpassing the previous year’s average of Rs.1.5 lakh crore. GST revenue net of refunds as of March 2024 for the current fiscal year is Rs.18.01 lakh crore which is a growth of 13.4% over same period last year.
Positive Performance Across Components:
Breakdown of March 2024 Collections:
- Central Goods and Services Tax (CGST): Rs.34,532 crore;
- State Goods and Services Tax (SGST): Rs.43,746 crore;
- Integrated Goods and Services Tax (IGST): Rs.87,947 crore, including Rs.40,322 crore collected on imported goods;
- Cess: Rs.12,259 crore, including Rs.996 crore collected on imported goods.
Similar positive trends are observed in the entire FY 2023-24 collections:
- Central Goods and Services Tax (CGST): Rs.3,75,710 crore;
- State Goods and Services Tax (SGST): Rs.4,71,195 crore;
- Integrated Goods and Services Tax (IGST): Rs.10,26,790 crore, including Rs.4,83,086 crore collected on imported goods;
- Cess: Rs.1,44,554 crore, including Rs.11,915 crore collected on imported goods.
Inter-Governmental Settlement: In the month of March, 2024, the Central Government settled Rs.43,264 crore to CGST and Rs.37,704 crore to SGST from the IGST collected. This translates to a total revenue of Rs.77,796 crore for CGST and Rs.81,450 crore for SGST for March, 2024 after regular settlement. For the FY 2023-24, the central government settled Rs.4,87,039 crore to CGST and Rs.4,12,028 crore to SGST from the IGST collected.
Chart: Trends in GST Collection
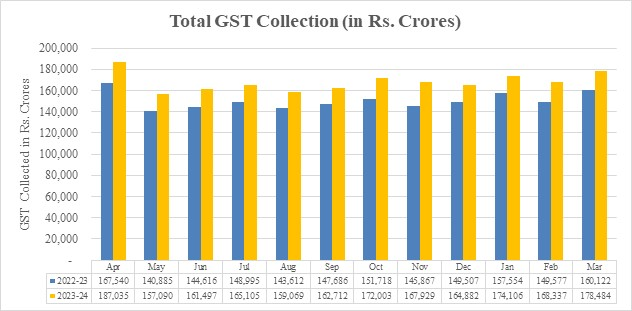
Table 1: State-wise growth of GST Revenues during March, 2024[1]
| State/UT | Mar-23 | Mar-24 | Growth (%) |
| Jammu and Kashmir | 477 | 601 | 26% |
| Himachal Pradesh | 739 | 852 | 15% |
| Punjab | 1,735 | 2,090 | 20% |
| Chandigarh | 202 | 238 | 18% |
| Uttarakhand | 1,523 | 1,730 | 14% |
| Haryana | 7,780 | 9,545 | 23% |
| Delhi | 4,840 | 5,820 | 20% |
| Rajasthan | 4,154 | 4,798 | 15% |
| Uttar Pradesh | 7,613 | 9,087 | 19% |
| Bihar | 1,744 | 1,991 | 14% |
| Sikkim | 262 | 303 | 16% |
| Arunachal Pradesh | 144 | 168 | 16% |
| Nagaland | 58 | 83 | 43% |
| Manipur | 65 | 69 | 6% |
| Mizoram | 70 | 50 | -29% |
| Tripura | 90 | 121 | 34% |
| Meghalaya | 202 | 213 | 6% |
| Assam | 1,280 | 1,543 | 21% |
| West Bengal | 5,092 | 5,473 | 7% |
| Jharkhand | 3,083 | 3,243 | 5% |
| Odisha | 4,749 | 5,109 | 8% |
| Chhattisgarh | 3,017 | 3,143 | 4% |
| Madhya Pradesh | 3,346 | 3,974 | 19% |
| Gujarat | 9,919 | 11,392 | 15% |
| Dadra and Nagar Haveli and Daman & Diu | 309 | 452 | 46% |
| Maharashtra | 22,695 | 27,688 | 22% |
| Karnataka | 10,360 | 13,014 | 26% |
| Goa | 515 | 565 | 10% |
| Lakshadweep | 3 | 2 | -18% |
| Kerala | 2,354 | 2,598 | 10% |
| Tamil Nadu | 9,245 | 11,017 | 19% |
| Puducherry | 204 | 221 | 9% |
| Andaman and Nicobar Islands | 37 | 32 | -14% |
| Telangana | 4,804 | 5,399 | 12% |
| Andhra Pradesh | 3,532 | 4,082 | 16% |
| Ladakh | 23 | 41 | 82% |
| Other Territory | 249 | 196 | -21% |
| Center Jurisdiction | 142 | 220 | 55% |
| Grand Total | 1,16,659 | 1,37,166 | 18% |
Table-2: SGST & SGST portion of IGST settled to States/UTs April-March (Rs. in crore)
| Pre-Settlement SGST | Post-Settlement SGST[2] | |||||
| State/UT | 2022-23 | 2023-24 | Growth | 2022-23 | 2023-24 | Growth |
| Jammu and Kashmir | 2,350 | 2,945 | 25% | 7,272 | 8,093 | 11% |
| Himachal Pradesh | 2,346 | 2,597 | 11% | 5,543 | 5,584 | 1% |
| Punjab | 7,660 | 8,406 | 10% | 19,422 | 22,106 | 14% |
| Chandigarh | 629 | 689 | 10% | 2,124 | 2,314 | 9% |
| Uttarakhand | 4,787 | 5,415 | 13% | 7,554 | 8,403 | 11% |
| Haryana | 18,143 | 20,334 | 12% | 30,952 | 34,901 | 13% |
| Delhi | 13,619 | 15,647 | 15% | 28,284 | 32,165 | 14% |
| Rajasthan | 15,636 | 17,531 | 12% | 35,014 | 39,140 | 12% |
| Uttar Pradesh | 27,366 | 32,534 | 19% | 66,052 | 76,649 | 16% |
| Bihar | 7,543 | 8,535 | 13% | 23,384 | 27,622 | 18% |
| Sikkim | 301 | 420 | 39% | 839 | 951 | 13% |
| Arunachal Pradesh | 494 | 628 | 27% | 1,623 | 1,902 | 17% |
| Nagaland | 228 | 307 | 35% | 964 | 1,057 | 10% |
| Manipur | 321 | 346 | 8% | 1,439 | 1,095 | -24% |
| Mizoram | 230 | 273 | 19% | 892 | 963 | 8% |
| Tripura | 435 | 512 | 18% | 1,463 | 1,583 | 8% |
| Meghalaya | 489 | 607 | 24% | 1,490 | 1,713 | 15% |
| Assam | 5,180 | 6,010 | 16% | 12,639 | 14,691 | 16% |
| West Bengal | 21,514 | 23,436 | 9% | 39,052 | 41,976 | 7% |
| Jharkhand | 7,813 | 8,840 | 13% | 11,490 | 12,456 | 8% |
| Odisha | 14,211 | 16,455 | 16% | 19,613 | 24,942 | 27% |
| Chhattisgarh | 7,489 | 8,175 | 9% | 11,417 | 13,895 | 22% |
| Madhya Pradesh | 10,937 | 13,072 | 20% | 27,825 | 33,800 | 21% |
| Gujarat | 37,802 | 42,371 | 12% | 58,009 | 64,002 | 10% |
| Dadra and Nagar Haveli and Daman and Diu | 637 | 661 | 4% | 1,183 | 1,083 | -8% |
| Maharashtra | 85,532 | 1,00,843 | 18% | 1,29,129 | 1,49,115 | 15% |
| Karnataka | 35,429 | 40,969 | 16% | 65,579 | 75,187 | 15% |
| Goa | 2,018 | 2,352 | 17% | 3,593 | 4,120 | 15% |
| Lakshadweep | 10 | 19 | 93% | 47 | 82 | 75% |
| Kerala | 12,311 | 13,967 | 13% | 29,188 | 30,873 | 6% |
| Tamil Nadu | 36,353 | 41,082 | 13% | 58,194 | 65,834 | 13% |
| Puducherry | 463 | 509 | 10% | 1,161 | 1,366 | 18% |
| Andaman and Nicobar Islands | 183 | 206 | 12% | 484 | 528 | 9% |
| Telangana | 16,877 | 20,012 | 19% | 38,008 | 40,650 | 7% |
| Andhra Pradesh | 12,542 | 14,008 | 12% | 28,589 | 31,606 | 11% |
| Ladakh | 171 | 250 | 46% | 517 | 653 | 26% |
| Other Territory | 201 | 231 | 15% | 721 | 1,123 | 56% |
| Grand Total | 4,10,251 | 4,71,195 | 15% | 7,70,747 | 8,74,223 | 13% |
Source: Press Release ID: 2016802

Share this content: